
Written By Margo Stoney, High Mountain Creative
Your 2023 Nonprofit Annual Report Design Content Checklist
Does putting together your annual report feel overwhelming? Since I already know the answer to that, I’ve put together this handy list and downloadable Annual Report Checklist to help organize your annual report or impact report. There are some great prompts for ideas to discuss with your graphic designer, printer, copywriter, or strategy team so you can come to the table with some fresh ideas to make this year’s annual report the best one yet.
Photos
Photos can make or break a good annual report and it’s important to make a plan for obtaining quality imagery.
- Don’t save photos for the last minute or expect a designer to curate images based on content unless it’s been discussed.
- Build a library of brand photos throughout the year.
- Take photos throughout the year capturing any events, meetings, etc. you’d like to highlight. Immediately upload them and organize them in a folder or drive where they can easily be shared later on.
- If you need to purchase stock photos, decide if you want to curate the photos yourself or get help from your designer. If you need help finding stock photos from a designer make sure you discuss this with them ahead of time so that there are no surprise costs.
Production & Layout
Here are some helpful questions to consider for your annual report layout. These can be discussed with your designer and printer.
- Will the report be printed or digital?
- If it’s printed, what quantity do you need?
- How many pages do you want the report to be? Keep in mind that folded, saddle-stitched (stapled) printed reports need to have pages in increments of four.
- Do you want the report to be landscape or portrait?
- Do you want the report to be a unique size or letter-sized?
- If it’s printed, how much will it cost to mail the report? Based on your budget, do you need to create a simpler version (eg one pager) that can save on cost?
- Who is your audience? Consider any specific accessibility needs for your demographic (font size, colors, etc)
- What are the key takeaways you want your audience to know? How does the design support these outcomes?
- Does this need to be mailed? If so, prepare a mailing list and be ready to provide it to the printer.
Letter from the CEO, Executive Director or Board Member
- Use a photo of the actual signature from the person for signing the letter to add a personal touch.
- This is a great place to foreshadow exciting updates for the year ahead. Use this space to also inspire future giving.
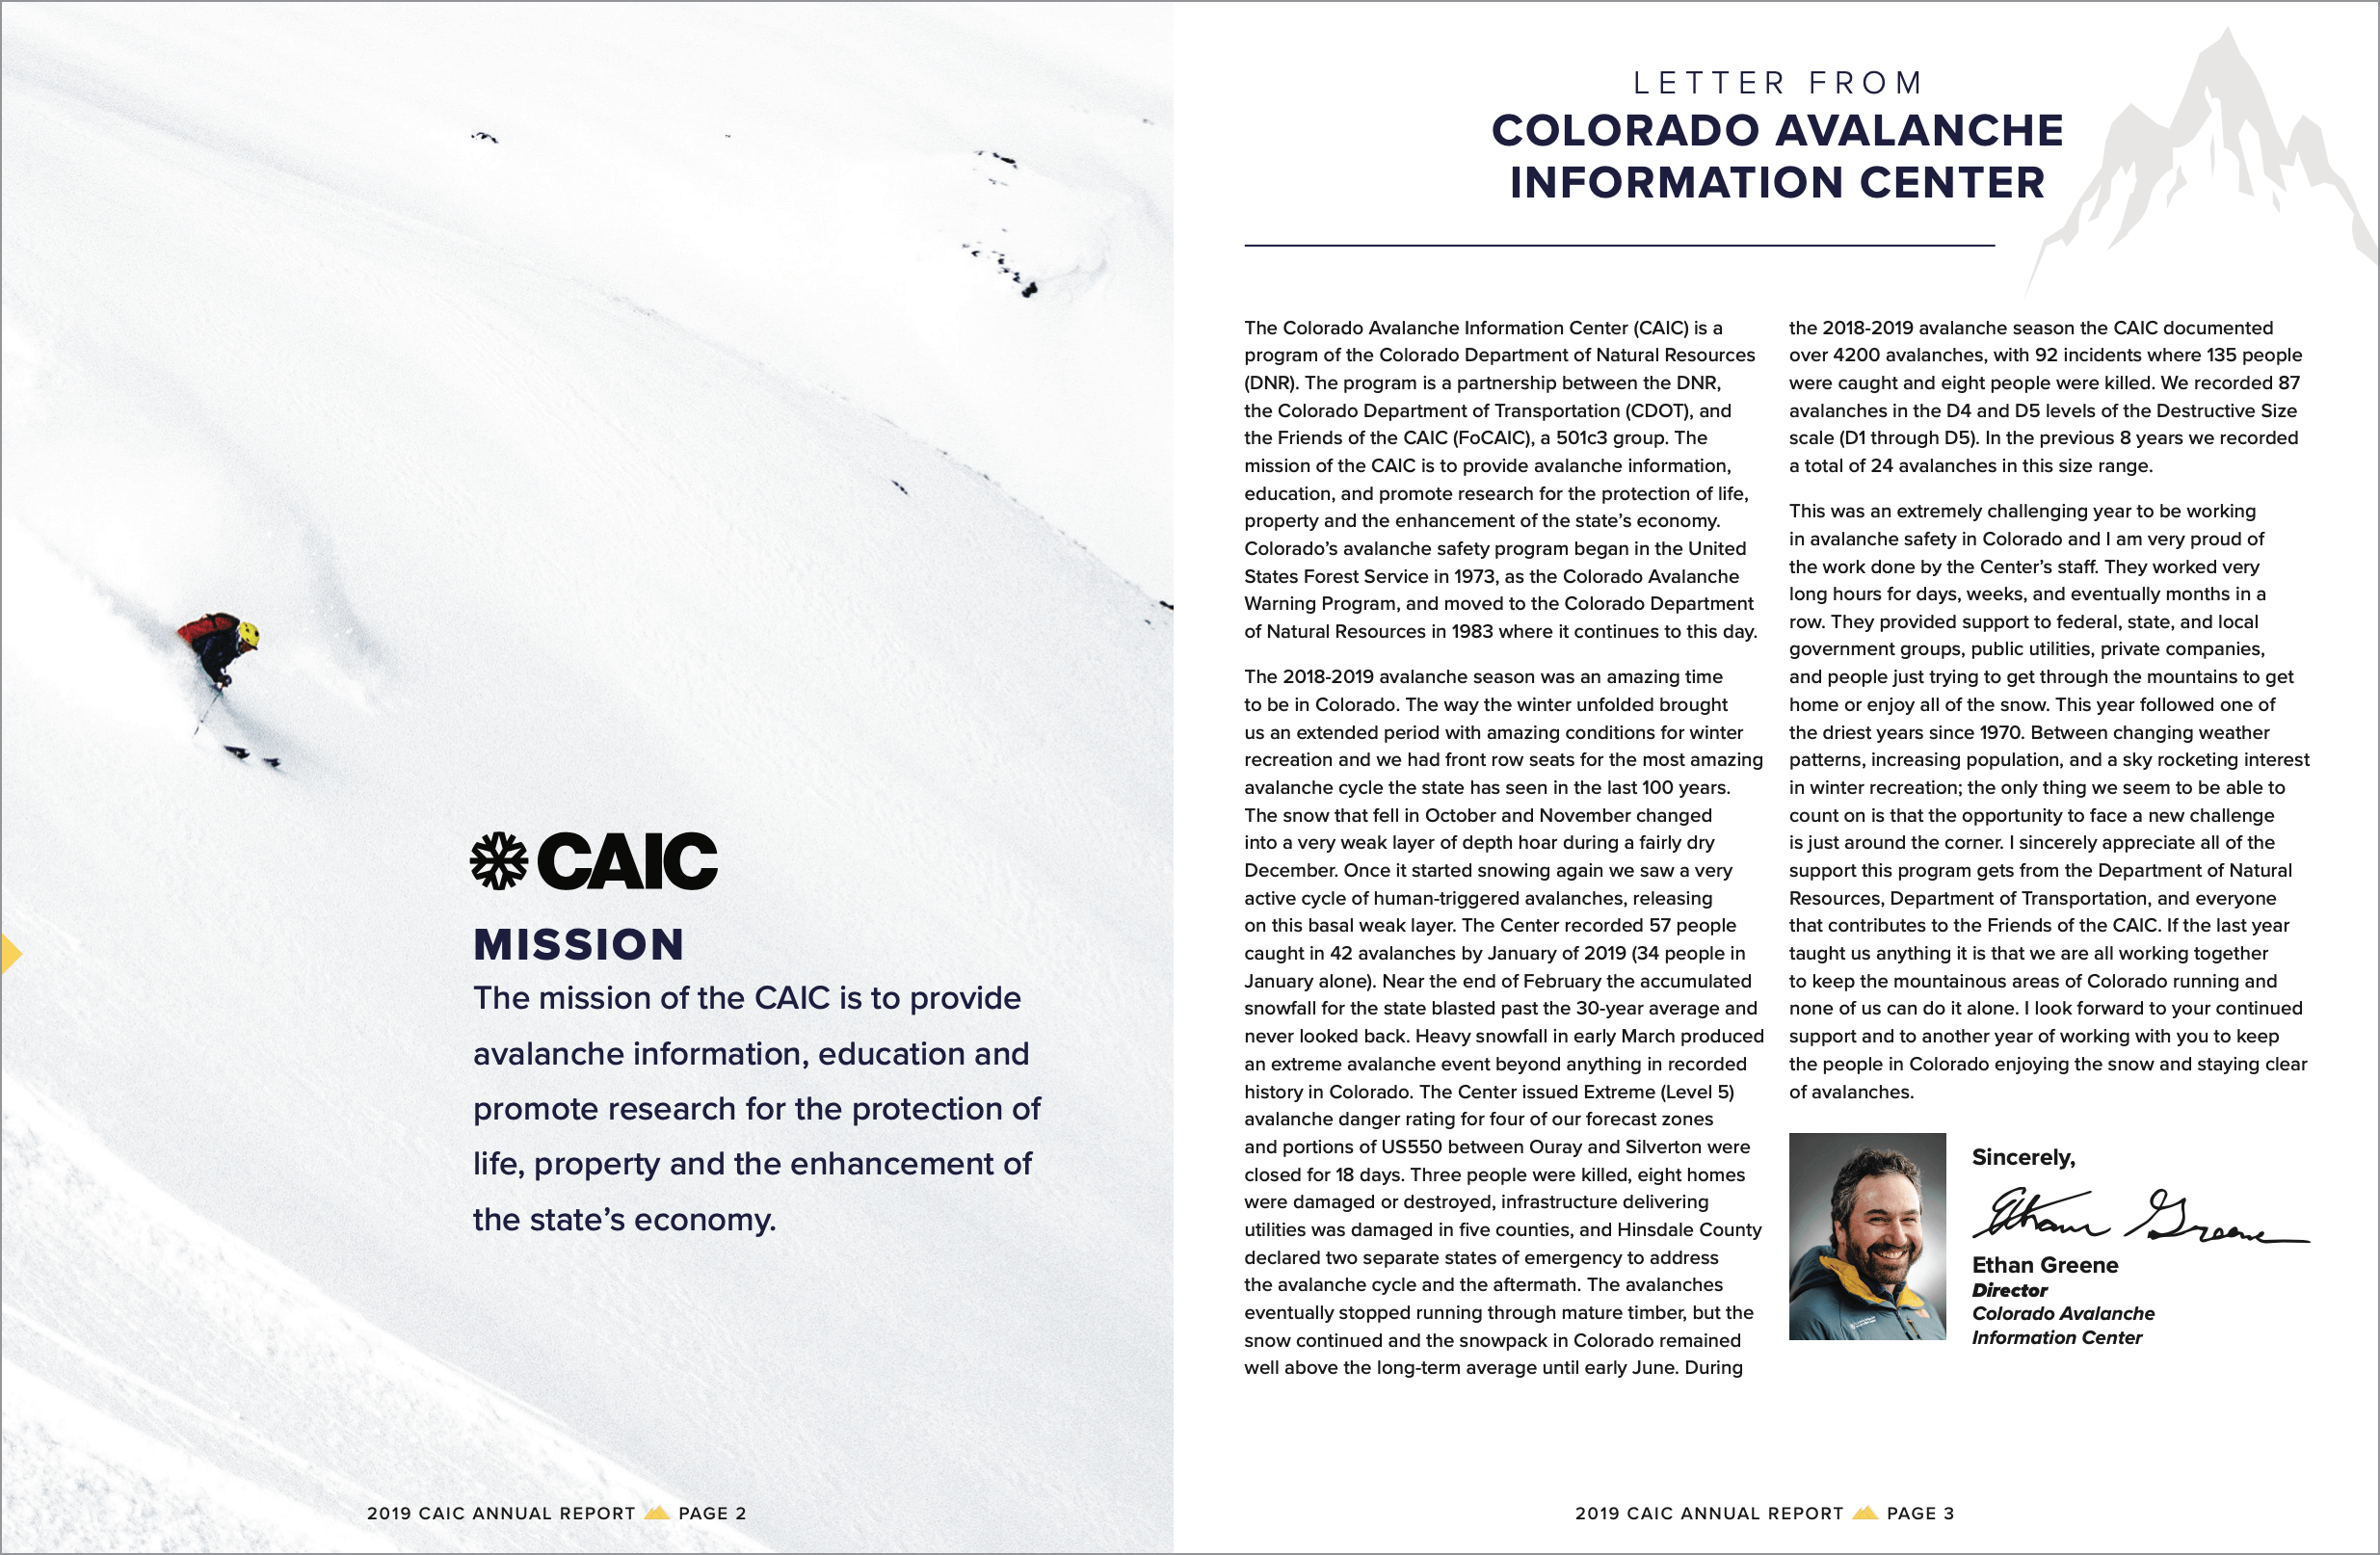
Mission Statement or Vision Statement
- Don’t let your mission get lost by tucking it into a paragraph of text!
- Make sure this is highly visible and easy to read. Even a one to two sentence mission statement could take up a full page or have a unique typographic or graphic treatment.
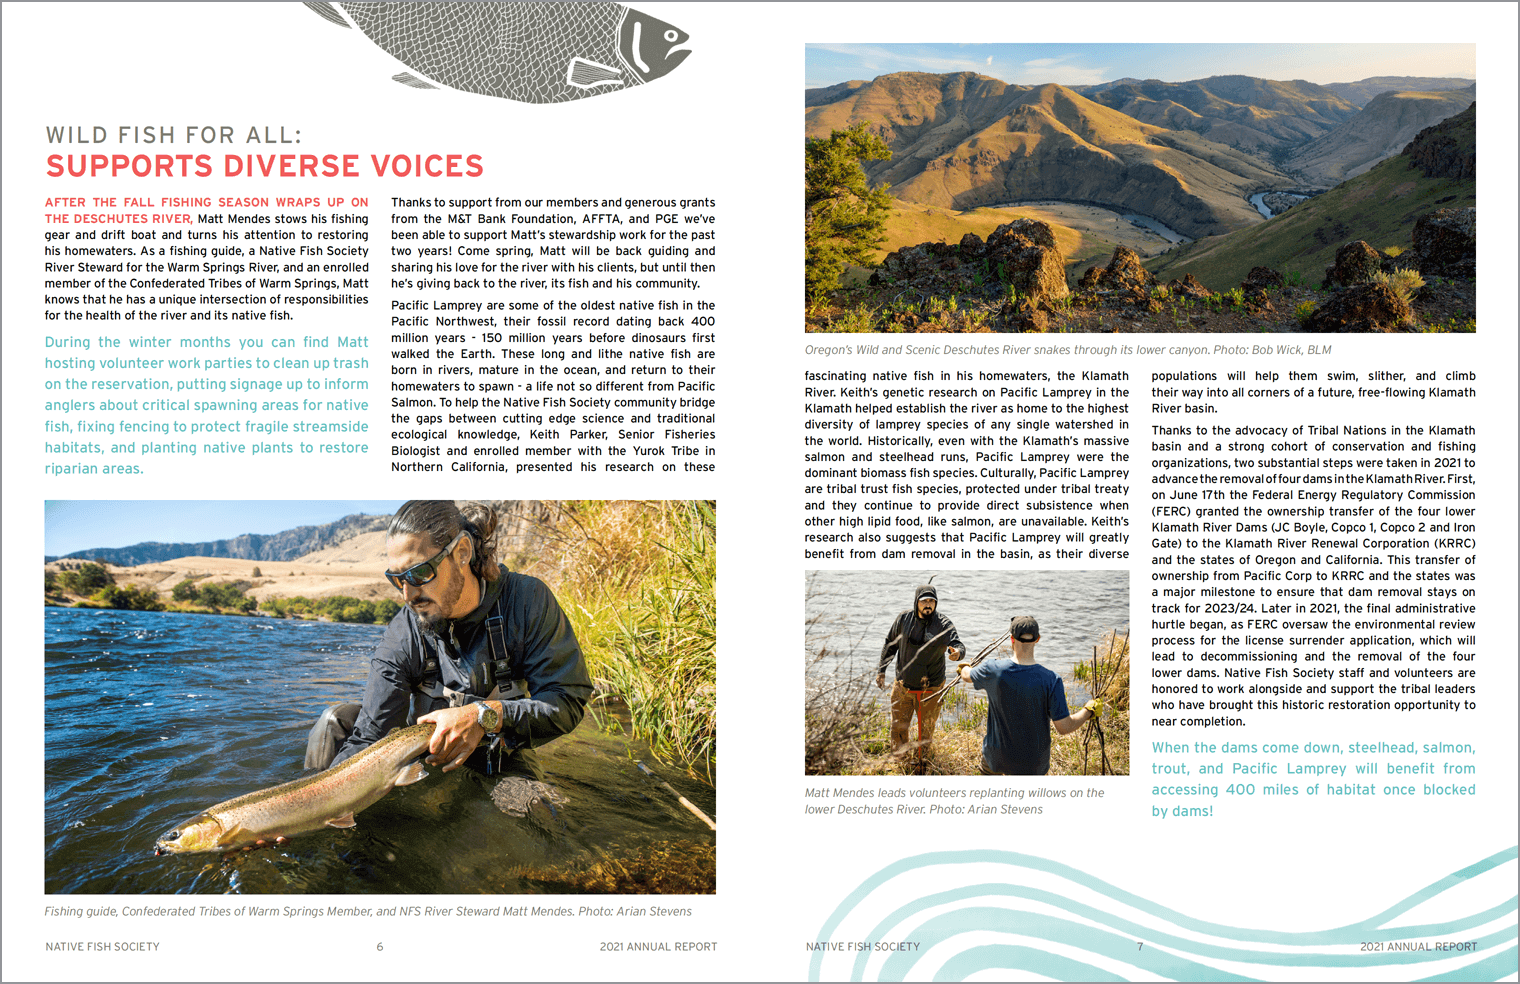
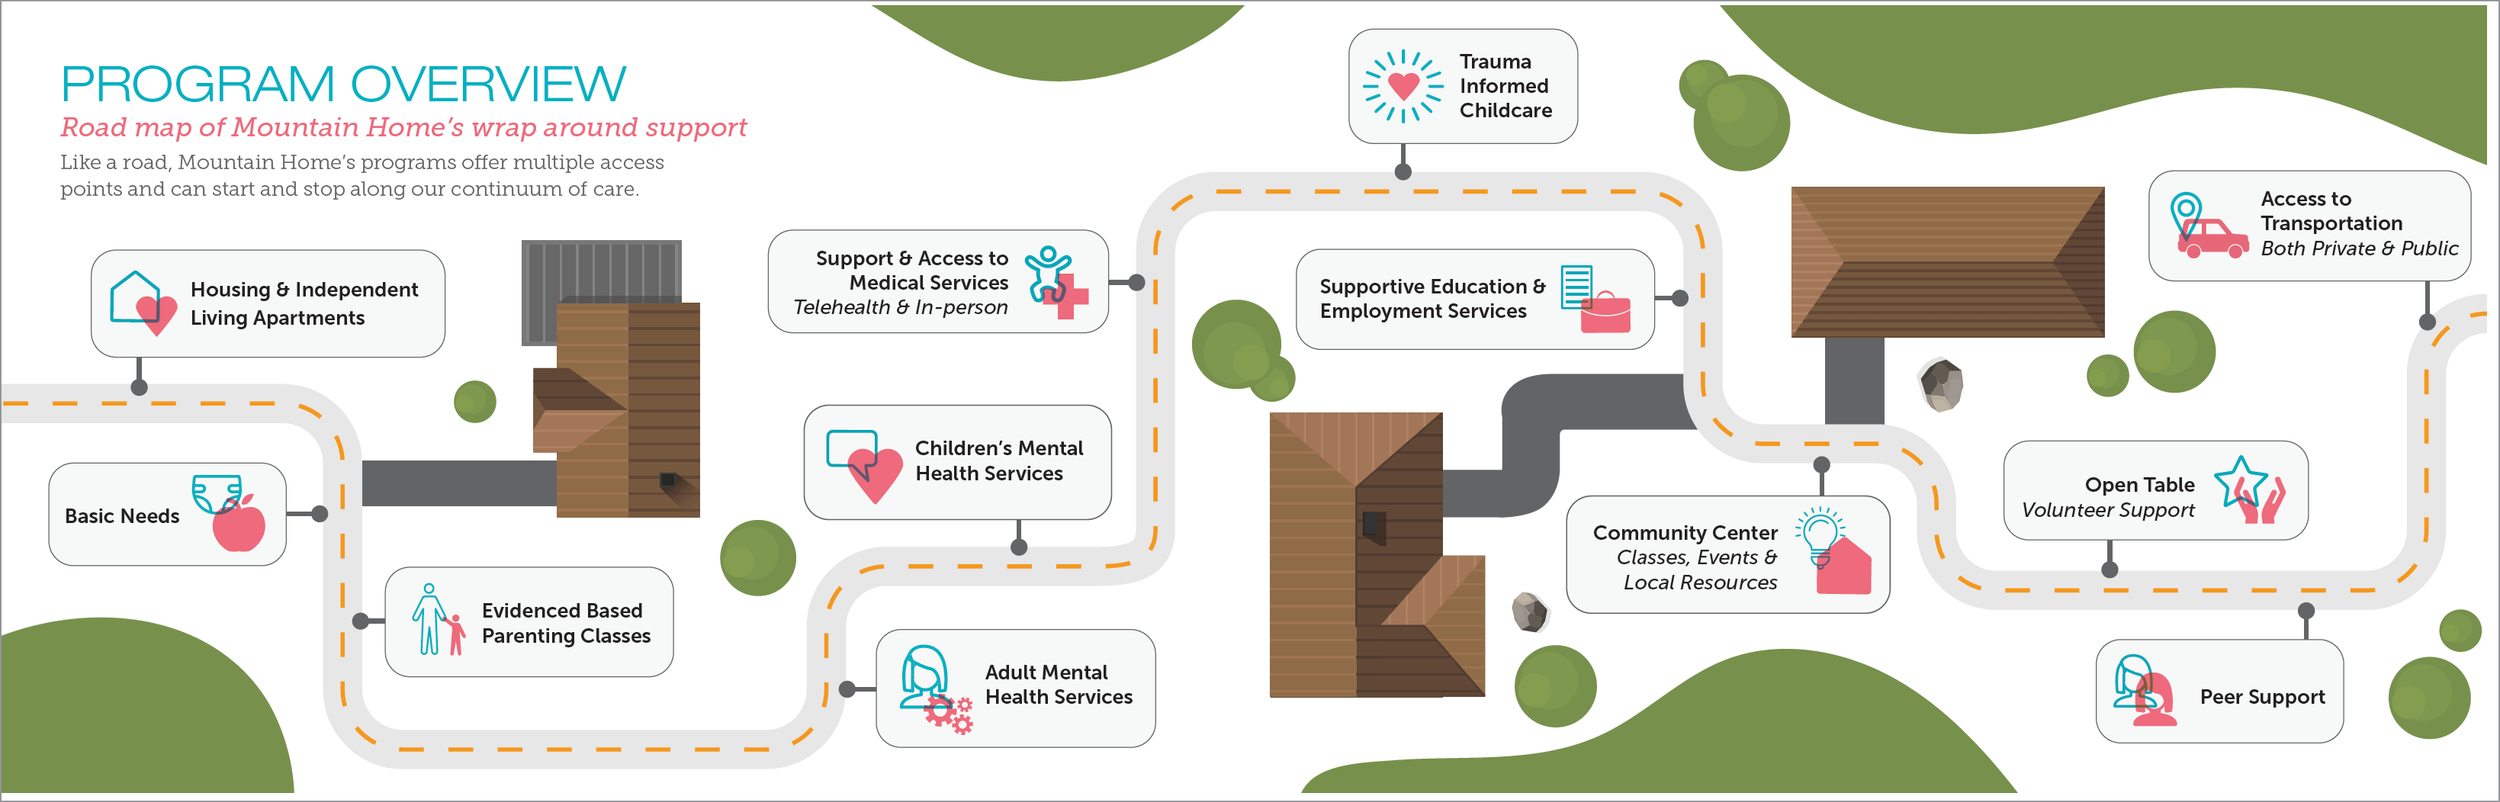
Overview of Programs or Initiatives
- Distill the informations about each of your programs into one or two easy-to-understand sentences.
- Don’t use any acronyms or language that a person unfamiliar with your organization might not immediately understand.
- Consider how you can incorporate photos or graphics into this section. Is there iconography that can be used in your annual report and also across the board with your brand to represent each program?
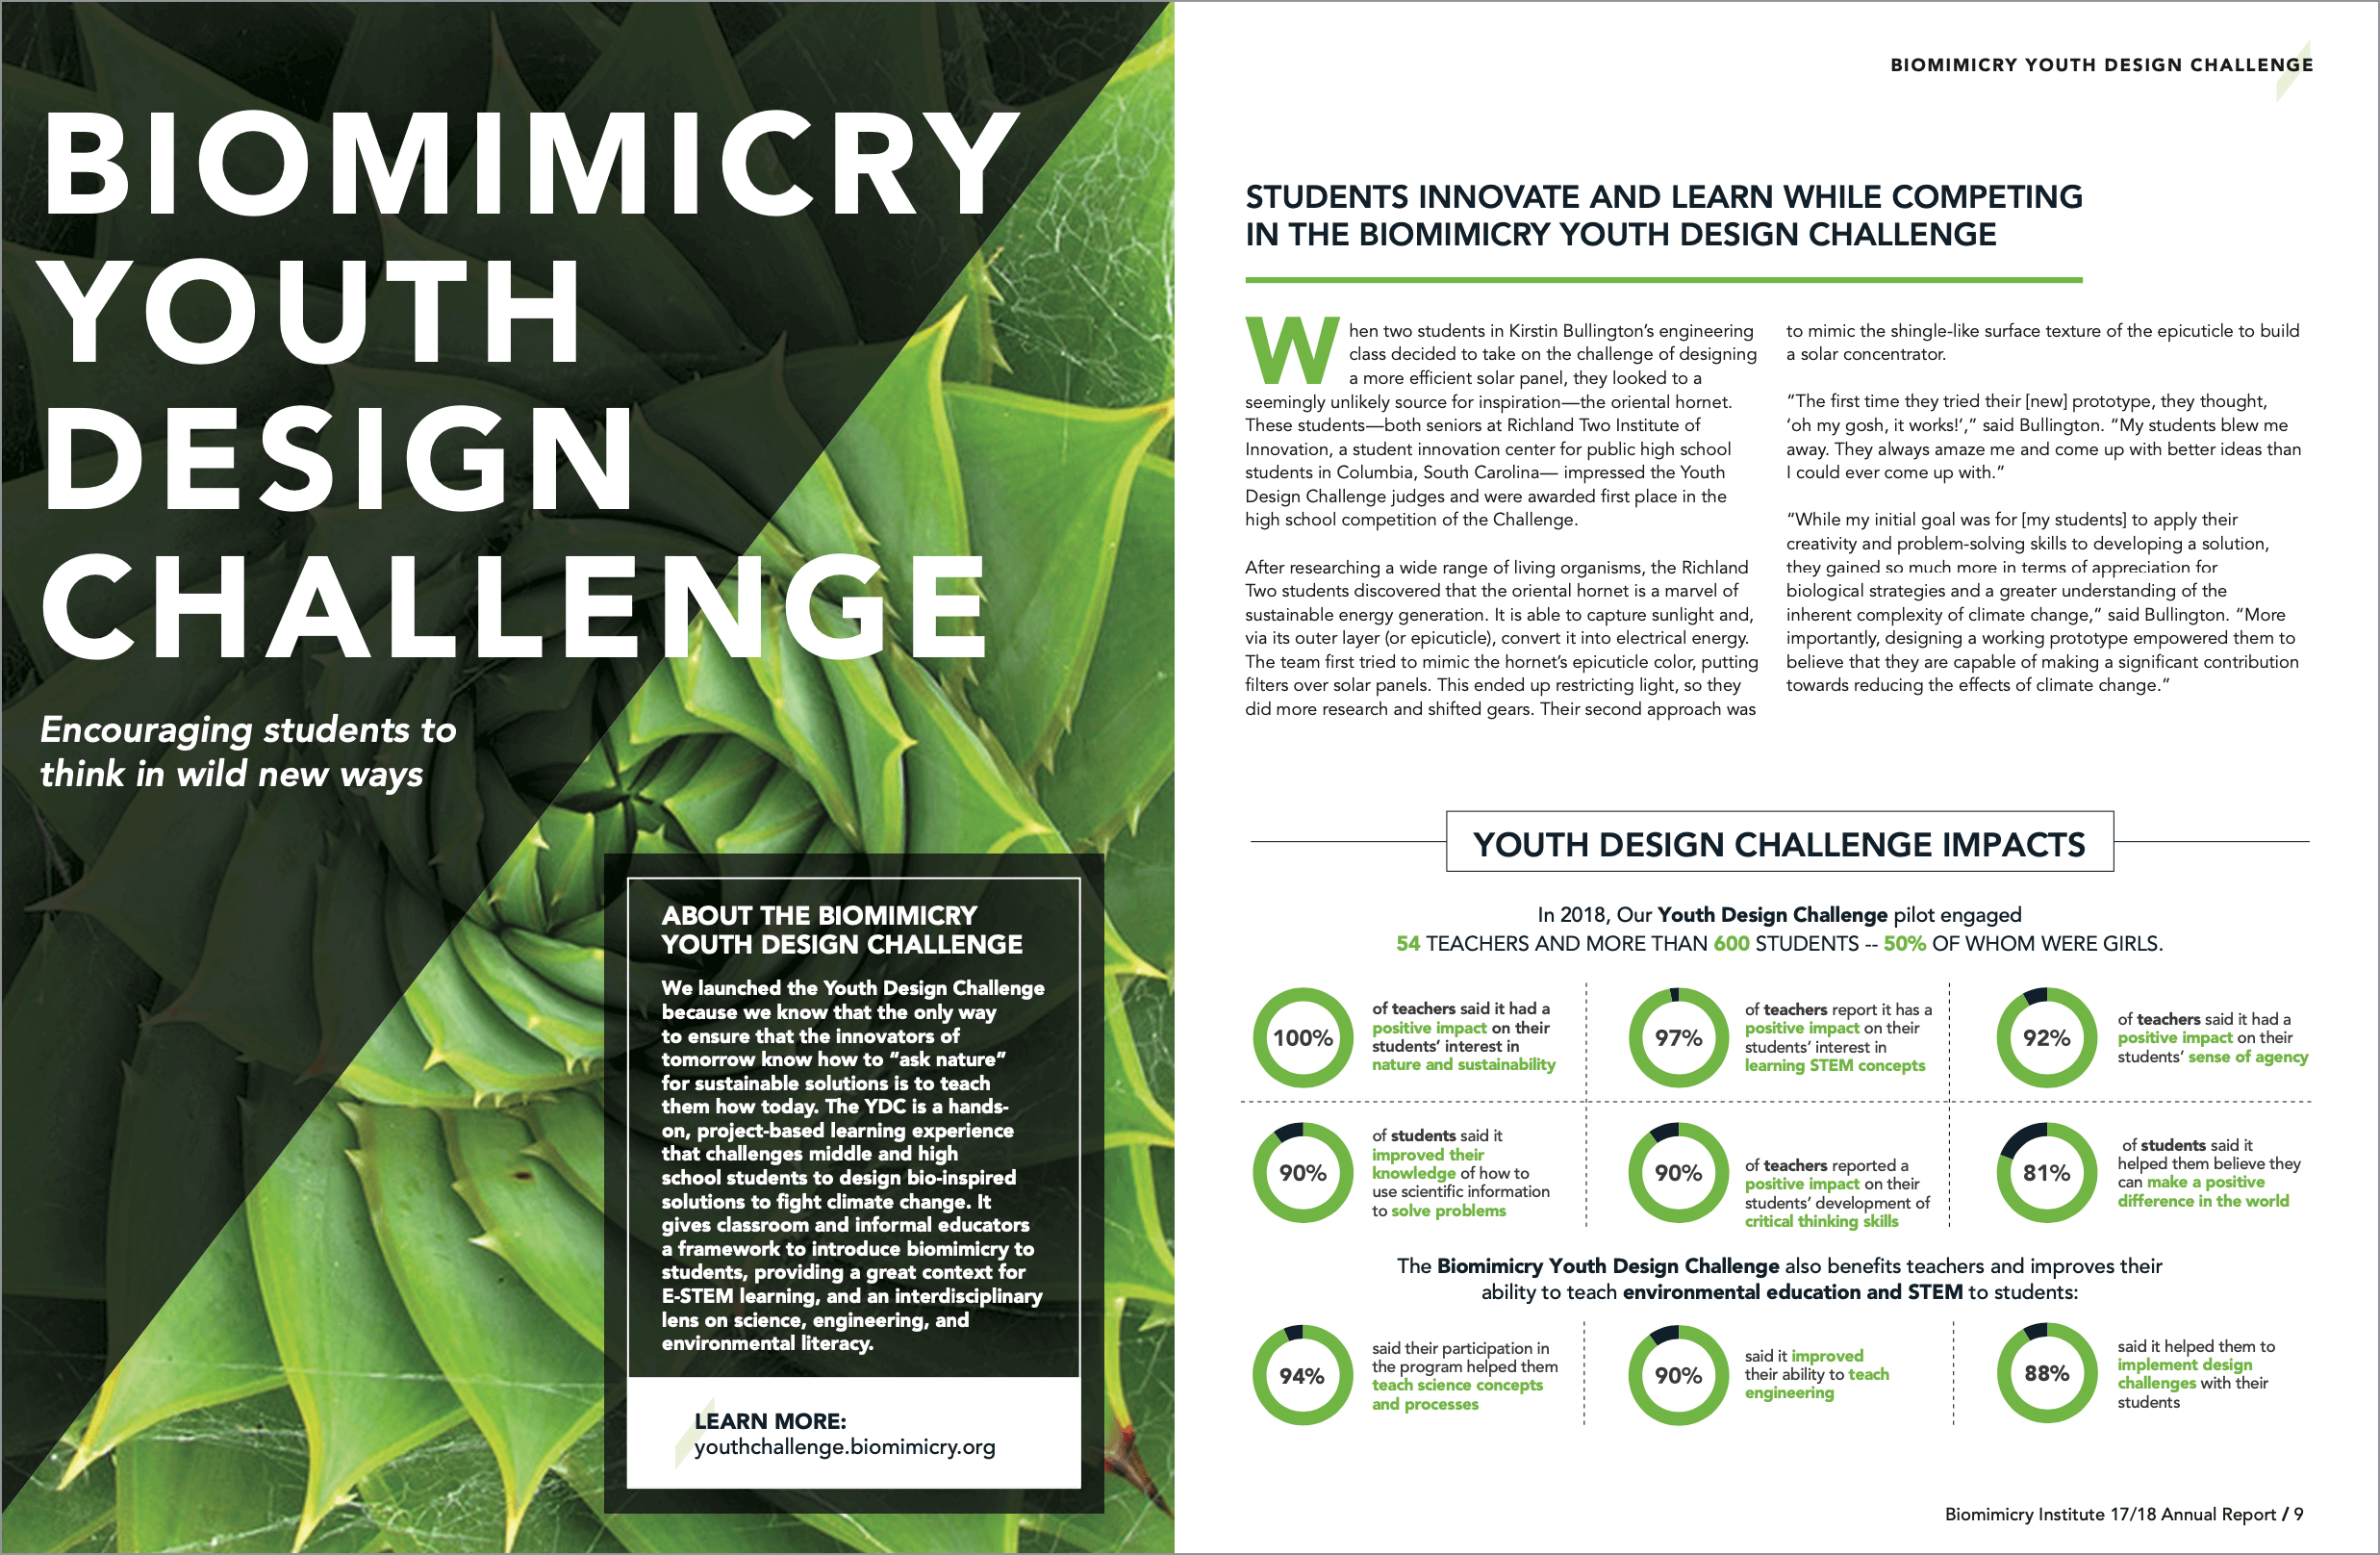
Unique Storytelling Content Ideas
- Year in review: Work up stats or metrics that can be used in an infographic design or displayed visually. Think about social or website engagement, # of volunteers, $ raised, people impacted, land or species protected, etc.
- Success stories: Share your big wins from the year. Maybe you met a fundraising goal or protected a new species. This is your place to brag!
- Donor Highlight: Share words and photos about a donor with a special story or went above or beyond last year. This would be a great opportunity to share an interview with a donor.
- Partnership Highlight: If there was an organization or business that helped you meet your goals last year, show your appreciation by talking about it in your annual report.
- Volunteer Recognition: This can be a fun way to put some faces to your organization and give a hardworking volunteer or group of volunteers a shout out for their work with your organization.
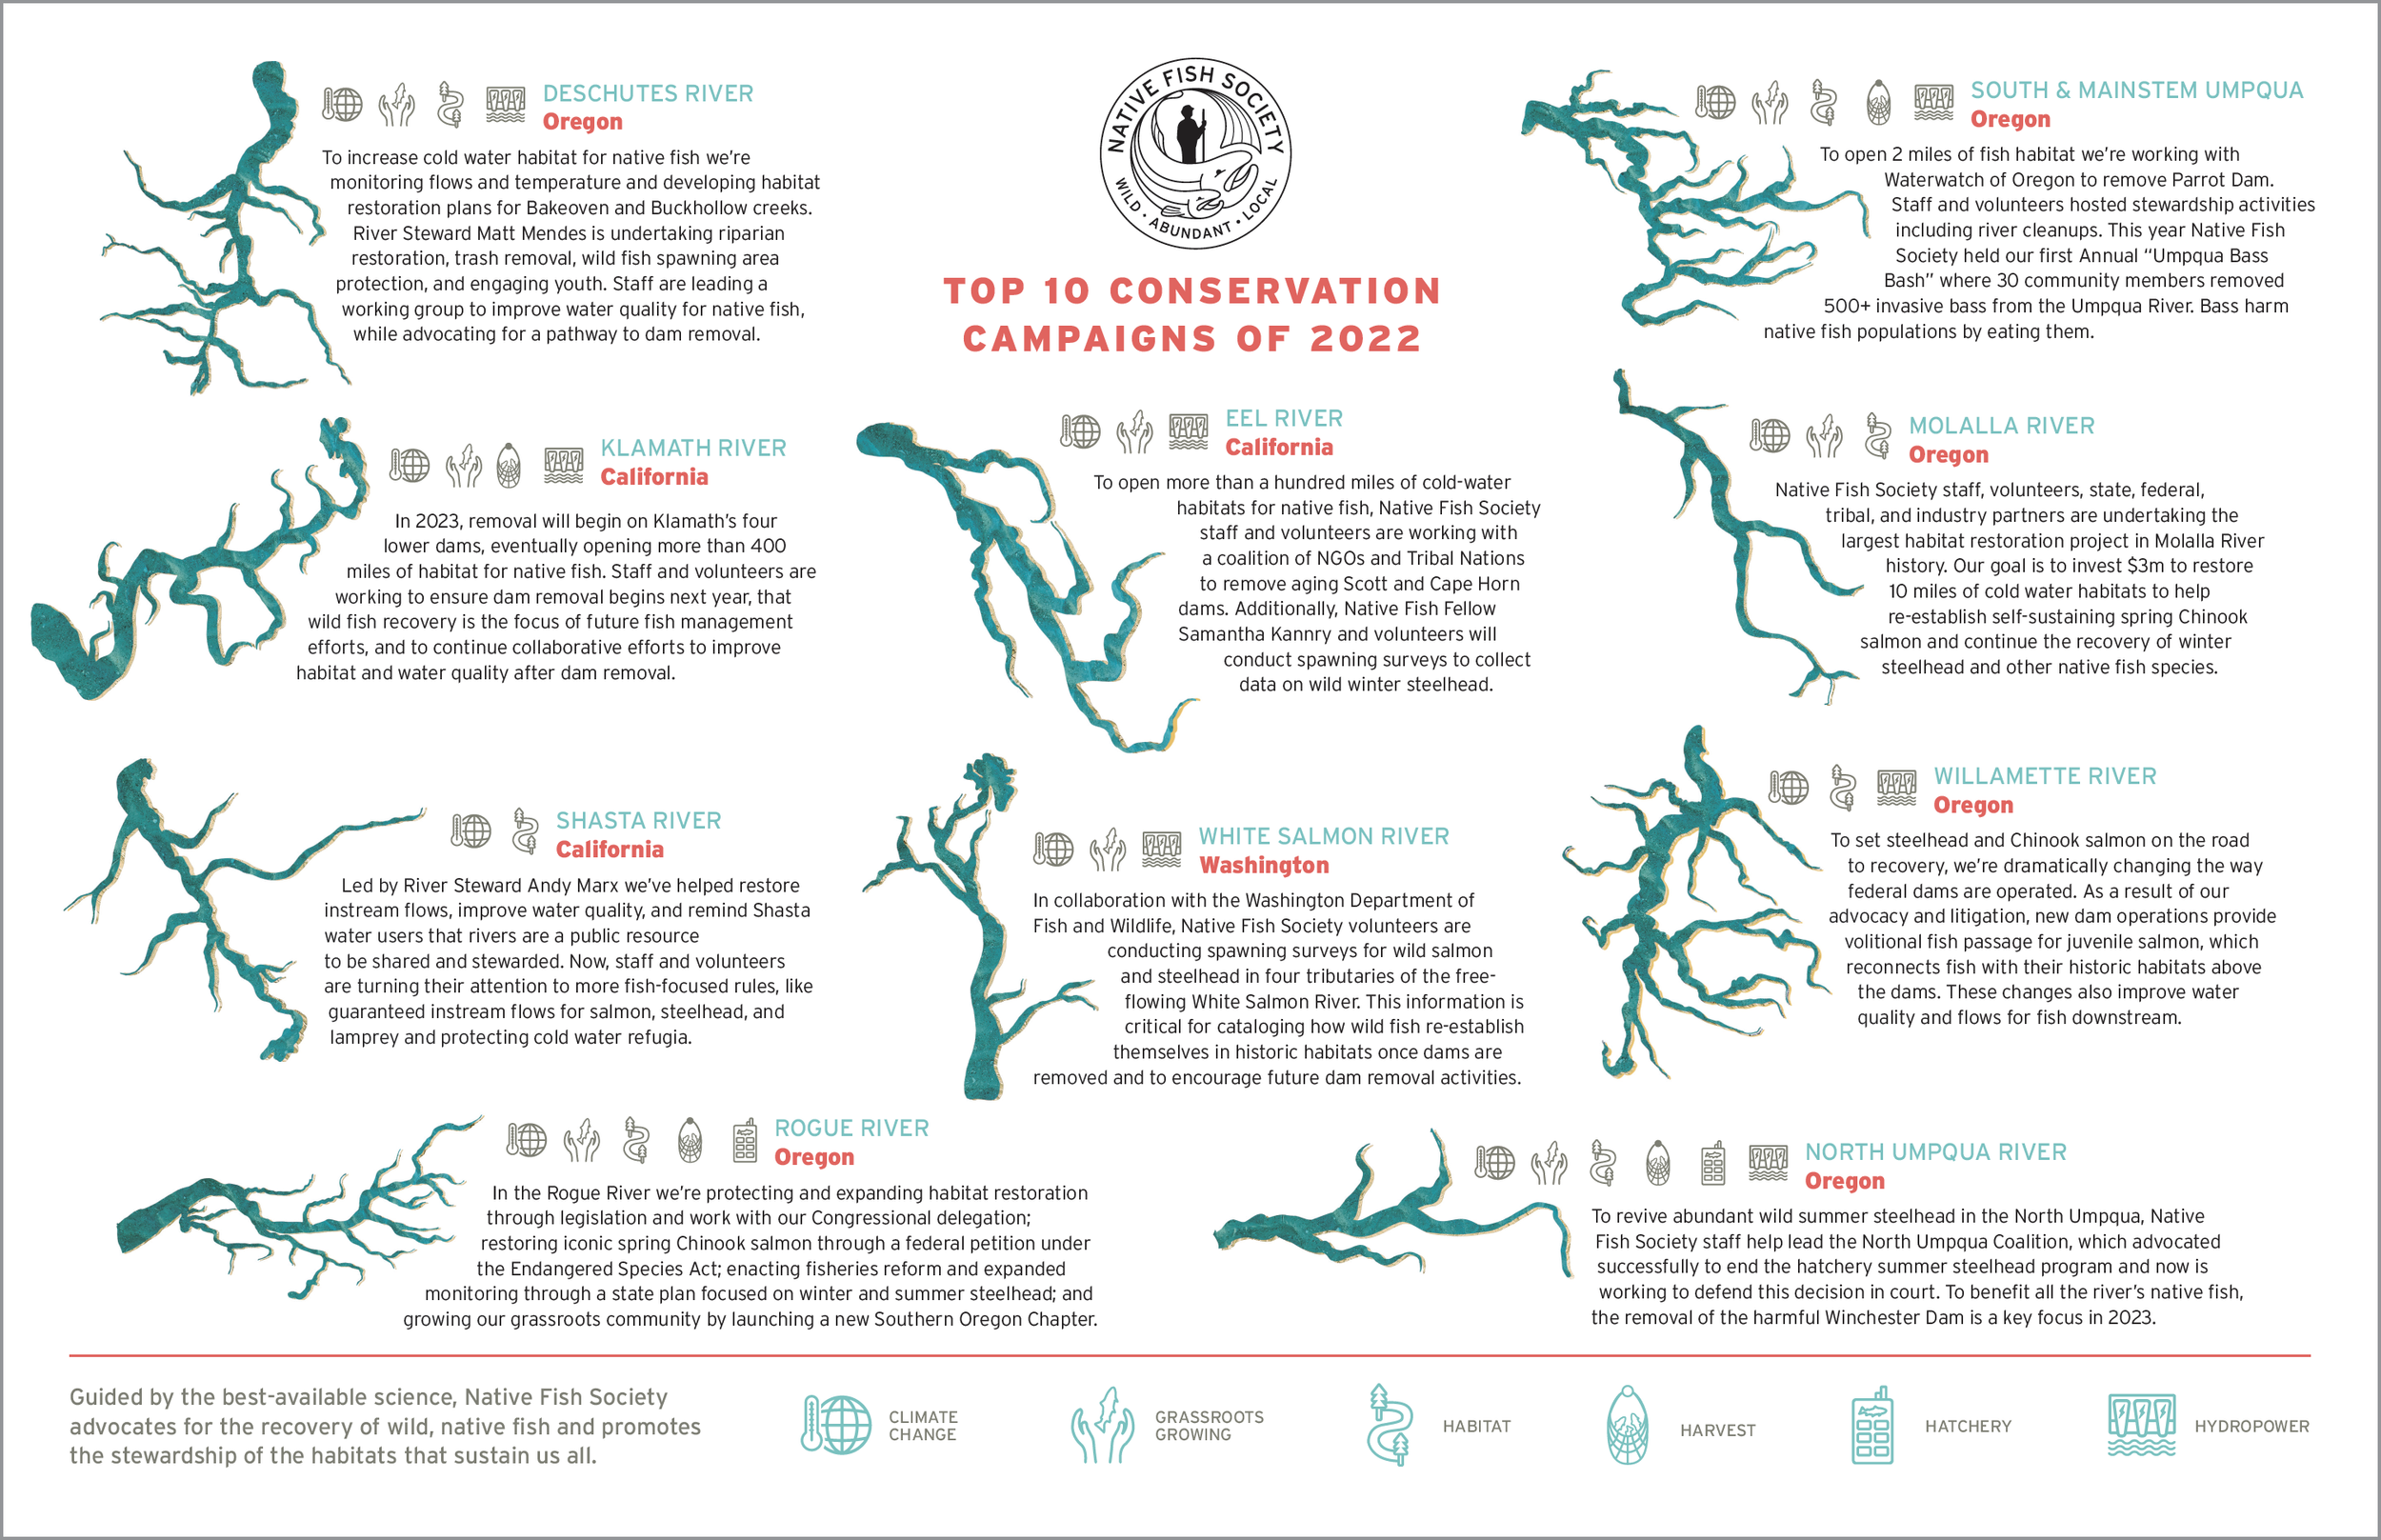
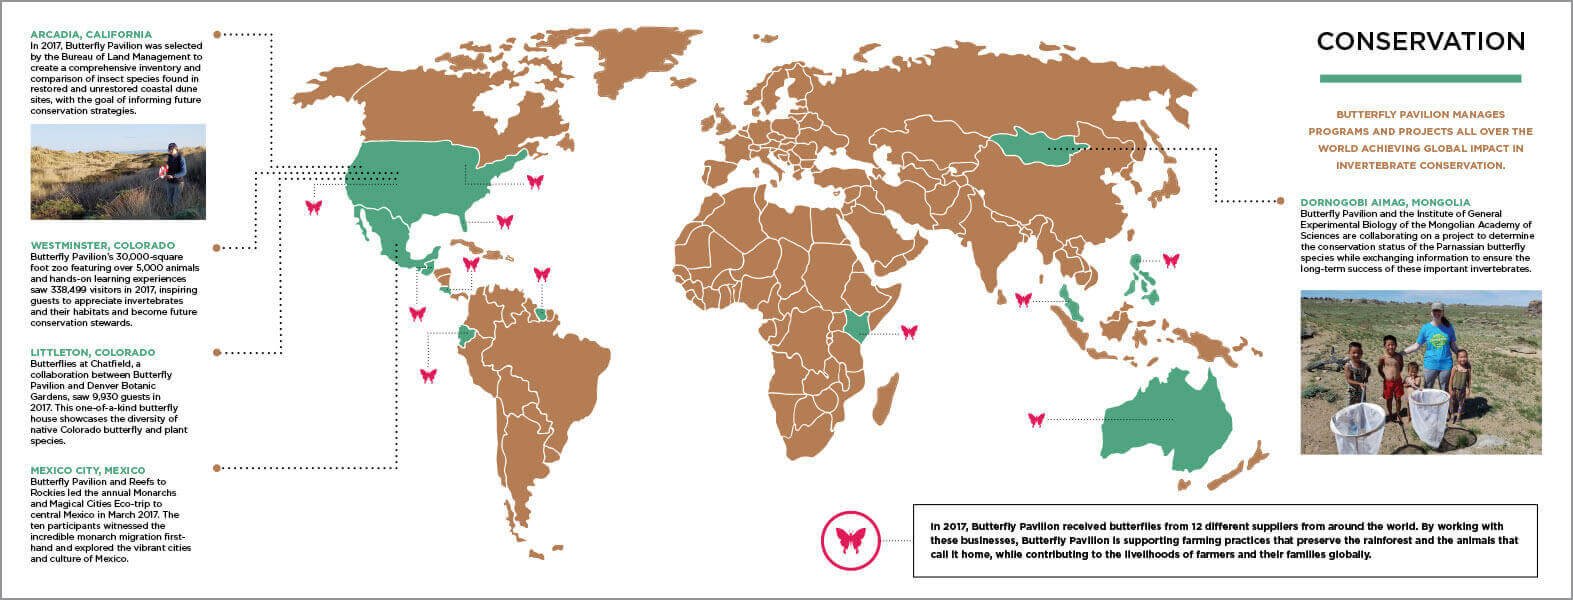
- Coverage Map: This could be an illustrated map highlighting the communities you positively impacted last year or a map indicating future coverage areas you hope to achieve through fundraising or a capital campaign.
- Capital Campaign Progress Report: If your organization is currently working on a capital campaign, share photos, stats, and updates to encourage donors to keep supporting progress.
7. Donors
- Consider how you will break this down. At what giving level are donors listed? Should you separate individuals and organizations? How will you break down endowments, legacy giving, etc?
8. Financials
- Talk to your designer about finding unique ways to visualize the financial data. There are a lot of cool ways to design a pie chart!
- Check out the Better Business Bureau’s annual report financial requirements to make sure you’re including the key financial information.
9. Staff & Board List
- Tip: If space allows, consider adding photos of your staff & board. Make sure you have photos that are consistent in quality and style. If it’s available to you, coordinate a photoshoot (professional or done in-house with a phone or digital camera) so that backgrounds, coloring, spacing of the headshots are similar.
I hope this list is helpful. Have anything to add? I’d love to hear from you!
Don’t forget to download your Annual Report Checklist!